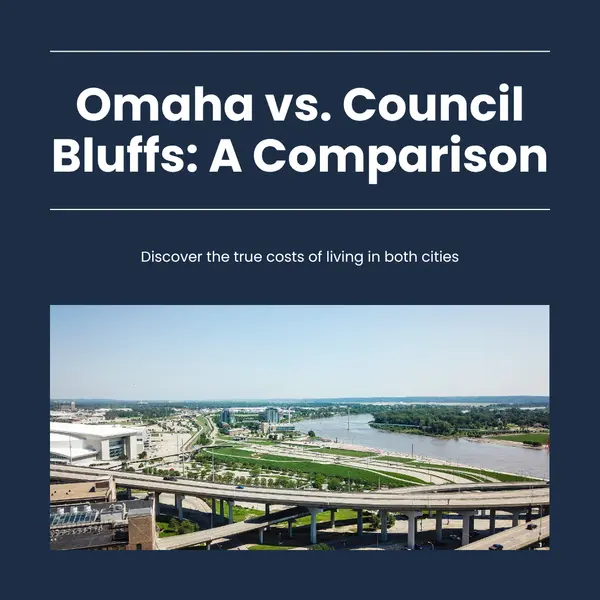
Omaha Real Estate Market Update: What the April Numbers Actually Reveal
A number that raised eyebrows in this post's original version quietly flipped positive. Earlier this spring, Omaha's closed sales were running 23% below last year — a figure I flagged as a timing issue, not a trend, because closings always lag contracts by 30 to 60 days. April confirmed that read. Closed sales are now up 7.6% year over year. The momentum signal was real.
What hasn't changed: this is still a tight, competitive market. The overall buyer pool is smaller than it was two or three years ago — elevated mortgage rates saw to that. But the people who are in this market right now aren't browsing. They're moving, and they're moving fast on the right homes.
April 2026 — Where Things Stand
Closed sales: Up 7.6% YoY — the lagged winter drag has corrected
Median closed price: $325,000 — steady appreciation, not a spike
New listings: Down ~15% YoY — supply is tightening, not expanding
Mortgage rates: ~6.5% (30-year fixed) — elevated but stable
Wondering what your home might be worth right now? Get a free home value estimate →
April Changed the Narrative
The single biggest shift since this post first published is the closed sales number. When I originally wrote this market update, closings were down 23.4% year over year — a number that looked alarming on the surface but made sense given the context. Those closings reflected contracts written during Omaha's slow winter stretch, and winter was genuinely slow.
April told a different story. Closings swung to +7.6% year over year, confirming that the spring pickup is real and the earlier dip was timing, not trend. That's the number worth anchoring on as we head deeper into spring.
The supply picture is the other headline. New listings dropped roughly 15% year over year in April — fewer sellers are bringing homes to market even as buyer activity picks back up. That's the combination that keeps prices stable and list-to-sale ratios high. It also means sellers who do list are facing less competition from other sellers, not more. That's a meaningful advantage that doesn't get talked about enough.
The Charts That Tell the Real Story
If you only look at one chart, look at showings per listing. That's the early indicator — it reflects whether buyers are actually getting out and looking, before those decisions show up in pending or closed numbers. And it's been elevated all spring.
Showings per Listing (Momentum Signal)
Showings per listing jumped to 5.3 early this spring (+12.8% YoY). Buyers who are in this market are actively shopping.
Months of Supply (3-Year Trend)
Months of supply remains around 2.0. Six months is considered a balanced market. We're well below that, and it's trending tighter, not looser.
Active Inventory (Supply Reality Check)
Active inventory remains constrained. This is not a market being flooded with new listings.
Median Closed Price (Value Trend)
Median closed price reached $325,000 in April. Appreciation is steady and consistent — not a spike, and not a retreat.
Who's Actually in This Market Right Now
Here's the thing about elevated mortgage rates: they filter the market. They don't stop real estate from happening — they change who's participating.
The buyers sitting on the sidelines waiting for the perfect rate to materialize aren't really buyers yet. The ones who are in this market right now are people who have to move — job relocations, growing families, life changes that don't wait for the Fed to make a decision. Those buyers are motivated. And motivated buyers compete.
Rates briefly dipped below 6% earlier this year, which pulled some fence-sitters back in. Global economic uncertainty pushed them back above 6% not long after, and they've settled into the current range around 6.5%. But the buyers who needed to move didn't stop moving when rates went back up. They adjusted, locked in, and got it done.
"I had a listing sit all winter with barely any activity. Early spring, three offers came in at once. The home hadn't changed — the buyer pool had."
That's not an isolated story. It's what happens when seasonal timing and motivated buyers line up. Homes that weren't resonating in November and December are moving in April and May. If a home has been sitting, it may not be a pricing problem — it may just have been a timing problem. Spring is when this market wakes up.
What This Means If You're Thinking About Selling
Three things are working in sellers' favor right now, and they're worth understanding before you decide whether to list.
Supply is shrinking. Fewer homes are coming to market — down roughly 15% year over year in April. That means less competition from other sellers. If you've been hesitating to list because you're not sure the timing is right, the irony is that your hesitation is helping create the conditions that make listing worthwhile. Every seller who waits is one fewer home your buyer has to choose from instead of yours.
Demand is concentrated among motivated buyers. The pool of casual shoppers has thinned. What's left are people who are serious, pre-approved, and ready to move. When a well-priced home hits the market, they notice it quickly. You don't need the whole market interested — you need the right buyer, and right now they're out there looking.
Values are holding. Omaha's median closed price reached $325,000 in April, up from $320,000 earlier this spring. List-to-sale ratios are still running above 98%. The market isn't overheated, but it isn't soft either. Sellers who price realistically are getting very close to what they ask for.
The one thing that hasn't changed: pricing still matters. This market does not reward overpricing. A home that comes in too high sits, and a home that sits gets a reputation. The right entry price generates activity fast. That's what produces multiple offers — not waiting for the perfect buyer to show up on their own.
| Timing Scenario | Working for You | Worth Watching |
|---|---|---|
| List now (spring) | Peak buyer activity, tight supply, strong showing traffic | Must be priced right — motivated buyers still negotiate |
| Wait until summer | More time to prep, stage, and make improvements | Buyer pool thins in late summer; families close before school starts |
| Wait until fall/winter | Less competition from other sellers in Oct–Nov | Fewer buyers overall; days on market typically longer |
If you're curious what your home might realistically sell for in this market, I do free home valuations — no pressure, just real numbers based on what's actually selling near you. You can also browse current homes in the $300K–$500K range to see what you'd be competing with as a buyer on the other side.
Free Download
Free Omaha Home Seller's Guide
Step-by-step guide to pricing, timing, and maximizing your net proceeds when selling in the Omaha market.
Download Free →A Word for Buyers
This post is mostly aimed at sellers, but if you're buying in Omaha right now, here's the short version: the best homes in Papillion, Elkhorn, Bennington, and other competitive submarkets are still moving quickly. The window to casually browse before something goes under contract is narrow.
What's shifted slightly in your favor is that price growth has moderated. You're not entering a frenzy market, but you're also not going to steamroll sellers on price. Prepare well, know your number before you start looking, and be ready to act when the right home surfaces. The mortgage calculator is a good place to get comfortable with your payment range. For the full playbook, the Omaha Home Buyer's Guide covers everything from pre-approval to closing with local context baked in.
Frequently Asked Questions
Is now a good time to sell in Omaha?
For most sellers, yes. New listings are down about 15% year over year, which means fewer homes competing for the same motivated buyer pool. Prices are holding at $325,000 median, and list-to-sale ratios are still above 98%. The main requirement is realistic pricing — the market rewards that quickly and punishes overpricing just as fast.
What happened to the closed sales numbers that were down 23% earlier this spring?
That number reflected contracts written during Omaha's slow winter months, which take 30–60 days to close. By April, those winter contracts had been replaced by spring-written deals, and closed sales swung to +7.6% year over year. It was a timing issue, not a sign of market weakness.
Mortgage rates are around 6.5% — should I wait for them to drop before buying?
Rates briefly dipped below 6% earlier this year before global economic uncertainty pushed them back to the current range. If you're waiting for rates to drop meaningfully, you're also waiting in line with a large group of buyers who will jump back in the moment they do. Finding the right home at the right price and refinancing later is often a better strategy than waiting for conditions that may not arrive on your timeline.
How do I know what my home is actually worth right now?
Online estimates (Zillow, Redfin) are useful as a starting point but rely on algorithms, not local knowledge. A real market analysis looks at what's sold near you in the last 60–90 days, accounts for condition and features, and factors in current competition. I do free home valuations with no obligation — just an honest number to help you make a good decision.
What's Your Omaha Home Worth in This Market?
Get a free, no-pressure home valuation based on what's actually selling near you right now.
Recent Posts